


The Rapid Christianization of Tribal Regions of Central India-the Story in Numbers

In our previous articles, we spoke of the areas where Hindus are under the imminent threat of becoming the minority: Western Uttar Pradesh [1], parts of West Bengal [2], Assam [3], Kerala and south Tamil Nadu [4], and Hill Jammu and Ladakh [5]. In our article on the demographic hotspots in the Hindi heartland, we focussed on the possibility of a Mughalistan corridor, due to rising Muslim population in the Hindi heartland and the possibility of linking Bangladesh and Pakistan via this corridor and other states [6]. In this article, we shall investigate the Christianization of the tribals in Northern, Central and Eastern India, namely in the states of Odisha, Chattisgarh and Jharkhand (Christianization has been low in the tribal belt of adjoining West Bengal and Telangana). This is the belt extending from the rapidly Christianising Nepal to the rapidly Christianising South India.
For the purpose of the article, we have grouped the Indic religions together. The Sikhs, the Jains, and the Buddhists have been grouped with the Hindus, since all these are extremely small in number. Due to inconsistent reporting and poor availability of earlier statistics, we have grouped Hindus and the various Sarna religions together, though the number of the tribal religions in many places is significantly high. The Muslims (where applicable) and the Christians are reported separately.
For reasons of historical consistency, since we consider districts as they existed in 1951, we have grouped the following districts together. When we speak of Ranchi, it comprises the present districts of Ranchi, Khunti, Gumla, Lohardaga, and Simdega. When we speak of Santhal Paraganas, it includes the present Deoghar, Dumka, Godda, Sahebganj, Pakaur and Jamtara. The district of Phulbani comprises the current districts of Baudh and Kandhamal. The district of Ganjam comprises the current Gajapati and Ganjam districts. Finally, the district of Raigarh comprises the current districts of Raigarh and Jashpur. The old district of Sundargarh is the same as the present district of Sundargarh. The districts have all also been considered individually in places where the difference between the districts matters.
In the article, the data and statistics we have presented must be regarded as the lower bound of Christian population. This is because the infrastructure of the state is poor in the tribal regions, the areas themselves are affected often by Leftist violence, and in these regions the people declare themselves in ways that are liable to subjective interpretations. Consequently, the accuracy of the data is questionable (this is not to suggest that the Indian state has indulged in the falsification of the data; merely, that data collection is itself problematic). Many Christians, John Dayal included [7], have claimed that the number of Christians on the census is an underestimate. The authors’ extensive interactions with various people in the states indicate a greater number of Christians in Odisha and Jharkhand than is reported in the census.
The Rise in Numbers:
All the districts under consideration (except Ranchi, which had 10.6% Christians) had 10% or fewer Christians in 1901. Actually, all districts, except Ranchi and Sundergarh, had no appreciable Christian minorities at all. In 1901, for instance, Santhal Paraganas were 0.5% Christian, Ranchi was 10.6% Christian, Sundargarh was 9.9% Christian in 1921 (no census before that), Phulbani was 0.05% Christian in 1921, Ganjam was 0.13% Christian. There are no statistics for Raigarh till 1951 (because the district was created by the amalgamation of several Princely states). Most Christians are in erstwhile Jashpur state and they numbered a paltry few according to the Chhattisgarh native states in 1901. As may be observed from the table below, Christian population was <10% in all these districts except Ranchi and Sundargarh even in 1951.
All these regions have been Christianised since, with the Christian population in many districts growing exponentially since 1991, as we observe below.
| Districts | Actual non-Indic Populations
M= Muslim, C=Christian |
Projected non-Indic Pop. in 2061
M= Muslim, C=Christian |
||||
| 1951 | 1991 | 2011 | Constant Growth | Polynomial | Logistic | |
| Santhal Parganas | 9.4% (M), 0.17% (C) | 18.25% (M),
1.67% (C) |
22.7%(M), 4.21% (C) | 28.36% (M), 30.16% (C) | 35.09% (M), 12.22% (C) | 30.9% (M), 8.95% (C) |
| Ranchi | 5.31% (M), 18.25% (C) | 8.35% (M),
15.71% (C) |
10.62% (M), 15.53% (C) | 18.76% (M), 14.63% (C) | 13.57% (M), 18.93% (C) | 15.4% (M), 13.79% (C) |
| Sundargarh | 0.9% (M) 13.04% (C) | 2.62% (M),
16.49% (C) |
3.4% (M) 18.46% (C) | 6.48% (M), 23.75% (C) | 5.04% (M), 21.33% (C) | 3.79% (M), 20.43% (C) |
| Phulbani | 2.4% (C) | 8.77% (C) | 12.84% (C) | 29.7% (C) | 23.31% (C) | 14.31% (C) |
| Ganjam | 0.74% (C) | 4.14% (C) | 5.94% (C) | 13.97% (C) | 9.98% (C) | 8.35% (C) |
| Raigarh | 0.58%(M), 8.65% (C) | 0.9% (M),
9.92% (C) |
1.76% (M), 10.6% (C) | 4.45% (M), 11.37% (C) | 2.73% (M), 18.58% (C) | 2.24% (M), 9.18% (C) |
Table 1: In this table, we have shown the non-Indic minority populations in the various districts where Indic populations are shrinking and Christian population is >5% or rapidly increasing. The projected non-Indic minority populations in the various districts by 2061 are shown. In places where the Muslim minority is <1%, it has been omitted. As may be observed, the Christian population is rapidly rising in most of these districts. In Ranchi, the Christian hit a low of 15.45% in 2001, but has risen to 15.53% in 2011, despite massive immigration into the district.
While none of these districts, with the possible exception of Santhal Paraganas, will be less than 50% Hindus in 2061 (at least, as expected now), the Christian population is set to grow rapidly in hitherto overwhelmingly Hindu areas of central India.
In Table 2, we have indicated when the Christian population is projected to cross the 20% of the total population using multiple methods.
| District | Constant Growth | Polynomial | Logistic |
| Santhal Paragana | 2051 | – | – |
| Ranchi | – | – | – |
| Sundargarh | 2031 | 2041 | 2051 |
| Phulbani | 2041 | 2051 | – |
| Ganjam | – | – | – |
| Raigarh | – | – | – |
Table 2: Shown in the table are the historical districts where Christians are expected to cross the 20% mark by 2061. Though in the three historical districts (Ranchi, Ganjam and Raigarh) the Christians are not expected to cross 20% by 2061, the newly carved districts from the historical ones have high Christian population. Gajapati district in old Ganjam; Simdega, Khunti, and Gumla in old Ranchi; and Jashpur in old Raigarh already have >20% Christians (Eg, Gajapati has 37% Christians and Jashpur has 22% Christians, Simdega is already Christian majority, Khunti has more than 25% Christians, Gumla has 19.75% Christians ).
Consequently, in a century and a half, starting from 1901, the Christian population is rising from nearly 0 to often more than 20%, which is a significant rise, considering that these areas were almost totally Hindu.
We have observed that the Christian population in the tribal heartland has been increasing in leaps and bounds since 1991. Summarizing, between 1991 and 2011, the Christian population of Jharkhand rose from 3.72% in 1991 to 4.06% in 2001 and to 4.3% in 2011. From 1951 to 1991, the Christian population of Jharkhand had fallen from 4.12% to 3.72% (mainly due to immigrations). However, the trend has been reversed since 1991 and Christian population has been rising again. In Odisha, Christian population grew from 2.1% in 1991 to 2.77% in 2011. In contrast, Christian population grew from 0.98% to 2.1% between 1951 and 1991. The nature of the rise becomes clear when we focus on specific districts within the states. In old Santhal Paraganas of Jharkhand the Christian population grew from 1.68% to 4.3% between 1991 and 2011, and in Singhbhum, the Christian population grew from 2.18% in 1991, to 2.59% in 2011, despite huge immigration into Singhbhum area. We now compare the percentage increase in Christian population, and the percentage growth of the population, between 1991 and 2011 in various districts of Jharkhand, Odisha and Chattisgarh.
| District | State | District Pop. Growth rate (1991-2011) | Christian pop. Growth rate (1991-2011) |
| Ganjam | Odisha | 29.64% | 85.49% |
| Phulbani | Odisha | 35.49% | 97.37% |
| Sundargarh | Odisha | 34.15% | 48.08% |
| Raigarh | Chhattisgarh | 33.15% | 39.18% |
| Ranchi | Jharkhand | 50.73% | 49.13% |
| Santhal Paraganas | Jharkhand | 35.21% | 280.52% |
Table 3: Table comparing the growth of Christian population and total population between 1991 and 2011 in the various districts of Chhattisgarh, Jharkhand and Odisha.
From the above table, it is clear that the Christian population growth (even in the census!) has substantially outpaced the population growth of the district, except in Ranchi. In the case of Ranchi, the disproportionate growth of the district is due to large scale of immigration due to industrialisation and these new immigrants are rarely tribals. Even in Ranchi, the Christian fall has turned the corner and risen from 15.45% in 2001 to 15.53% in 2011, despite huge immigration into the district. It is therefore clear that the tribals of Jharkhand, Odisha and Chattisgarh are being converted large scale in the last 20 years.
However, it is pertinent to remark that Christianisation is very non-uniform, so while the 1951 districts often show Christian population percentages in 5-25% overall range in the 2011 populations, many recently created districts (from the old 1951 districts) have often higher Christian populations.
In the map below, we have shown those recently carved districts (out of the old ones) where the Christian population is high (in blue) or rising sharply (purple).
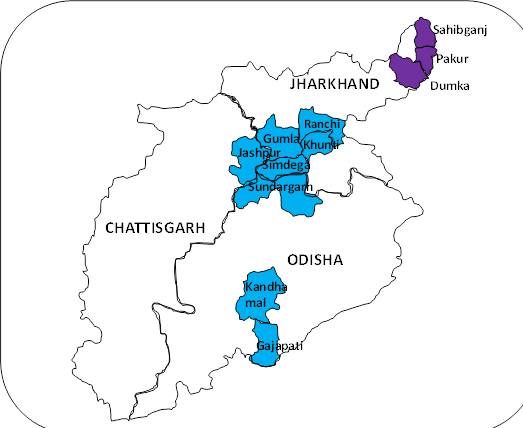
Illustration 1: The districts that have Christian population >5% have been marked on the map in blue. In purple are marked the districts where Christian populations are rising very sharply.
In old Santhal Paraganas, the rise of Christian population in Dumka, Pakaur and Sahebganj (shown in purple) has been sharp (all three have Christian populations >5% in 2011, from a miniscule number three decades ago), while the Christian population of Godda, Deogarh and Jamtara has remained more stable. Similarly, in old Ranchi, Khunti, Gumla and Simdega show a high Christian population (>20% in all three), while the current Ranchi district has a relatively lower Christian population. In (old) Phulbani district, Baudh has almost no Christian population, while Kandhamal has a Christian population of 20% in 2011. In old Ganjam district, Ganjam has a very small Christian population, while Gajapati has very high (37%) Christian population. Finally, in old Raigarh, Raigarh has a very small Christian population, while Jashpur has a Christian population >20%. Sundargarh, which has remained unchanged in its boundaries till 2011, has had a higher Christian population since the 1950s.
In the maps below, we have shown the Christian majority tehsils of Odisha and Jharkhand (no tehsil in Chattisgarh is currently Christian majority). As may be observed, they appear at the southern and northern ends of Odisha, and along the western border of Jharkhand. As an interesting point, we remark that it was on the edge of this Christian majority region of Kandhamal (in Tamudibandha tehsil) that Swami Lakshmananda was murdered. Tamudibandha tehsil, while not yet Christian majority (it is ~35% Christian now), has been rapidly rising by 6% between 2001 and 2011.
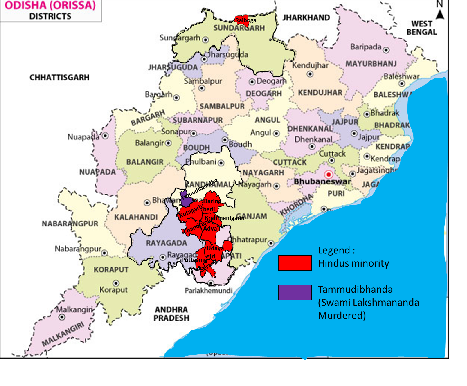
Illustration 2: The map shows in red, all the tehsils of Odisha that have a Hindu minority. Also, in order to indicate where Swami Lakshmananda was murdered, the tehsil (which has 63% Hindus according to 2011 census) has been marked in purple. This tehsil is also losing Hindus rapidly – it lost 6% Hindus between 2001 and 2011.
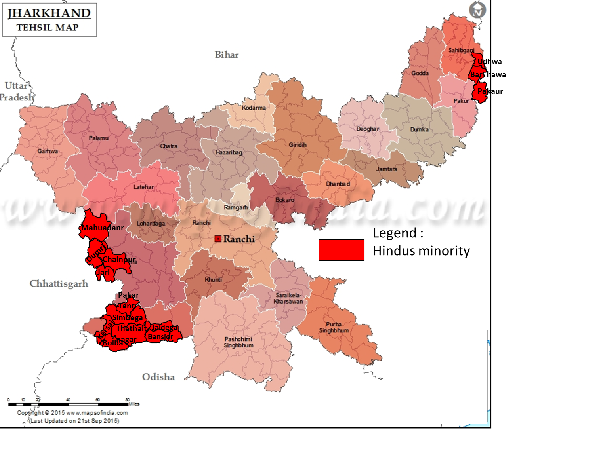
Illustration 3: The Hindu minority tehsils of Jharkhand. Most of them are along the Western and North eastern borders. Between Christians and Muslims, the Christians are dominant in the western border, and the Muslims in the North East. However, Christianisation of the North eastern part of Jharkhand is also progressing rapidly.
In Table 4, we have shown the districts that have 5% Christians or are showing high Christian growth in the last two decades. It must be remembered that even in 1901, most of these districts barely had any Christians. The changes that have been occurring are new and rapid.
| District | State | Christian Pop. In 2011 |
| Sahebganj | Jharkhand | 7.23% |
| Pakaur | Jharkhakd | 8.43% |
| Latehar | Jharkhand | 6.55% |
| Dumka | Jharkhand | 6.54% |
| Ranchi | Jharkhand | 6.66% |
| Khunti | Jharkhand | 25.65% |
| Gumla | Jharkhand | 19.75% |
| Simdega | Jharkhand | 51.14% |
| Paschimi Singhbhum | Jharkhand | 5.83% |
| Sundargarh | Odisha | 18.39% |
| Gajapati | Odisha | 37.98% |
| Kandhamal | Odisha | 20.31% |
| Rayagada | Odisha | 8.77% |
| Jashpur | Chhattisgarh | 22.96% |
Table 4: List of districts in Odisha, Chhattisgarh and Jharkhand where the Christian minority population is 5% or greater. All the statistics for Odisha, Chhattisgarh and Jharkhand have been taken from the 2011 census.
It is interesting to observe that these districts are connected geographically, forming almost a corridor. Illustrations 2 & 3 clearly reveal that this corridor begins at the southern end of the tribal heartlands of southern Odisha in Rayagada, and then passes into Gajapati and Kandhamal, where Christianisation is high in recent years. It makes its way further north via old Sambalpur (where Christianisation is just a shade below 5%) and then passes into Christianised Sundargarh. Here it swings in a wide fan northward, from Jashpur in Chhattisgarh and Simdega, Gumla, and Latehar in Jharkhand, before turning eastwards into Khunti, Ranchi and Paschim Singhbhum. There is a small gap after this due to the industrial region of Dhanbad and Jamshedpur, but then Christianisation is again rising rapidly in the NE Jharkhand, in the eastern part of old Santhal Paraganas – Dumka, Sahebganj and Pakaur, where the Santhals are being organised under the Christian church.
This Christian stronghold lies in the tribal heartland of India. The tribal heartlands of India extend in a south-west to north-east direction, with the south-western end of the corridor in Northern Telangana (Adilabad and Bhadrachalam districts), and the north-eastern end of the corridor in western West Bengal (Purulia and Birbhum districts) and north-eastern Jharkhand (Santhal Paraganas). The tribal corridor covers all of western and central Odisha (everything north west of a line connecting Mayurbhanj and Gajapati districts), all of Jharkhand (excluding a few industrial cities like Jamshedpur, Bokharo and Dhanbad, that have been planted in its midst), all of Chhattisgarh, south eastern Madhya Pradesh (Shahdol and Mandla districts) and the north eastern corner of Andhra Pradesh (Srikakulam).
This tribal heartland is vital to India due to the fact that the region has never been conquered by the Islamists. Even when the Islamists managed to win wars against this tribal region, the region remained untouched by Islamists and was a solid block of Indic population. The declining Indic population in a contiguous corridor within this hitherto solidly Indic region is a cause for concern, particularly given the rate at which the Indic population is being Christianised. It is safe to say that as late as 1700, the Indic population in every single district in the region was easily over 95% and as late as 1850, the Christian population of the region was miniscule (<1%). This latter factor is rapidly changing.
Statistical Details of Growth of Christian population
For all the districts that have been named, we have computed the growth rates across different communities of significance using the constant growth, the polynomial and the logistic models. We have analysed the results of all the three techniques separately.
Constant Growth Model:
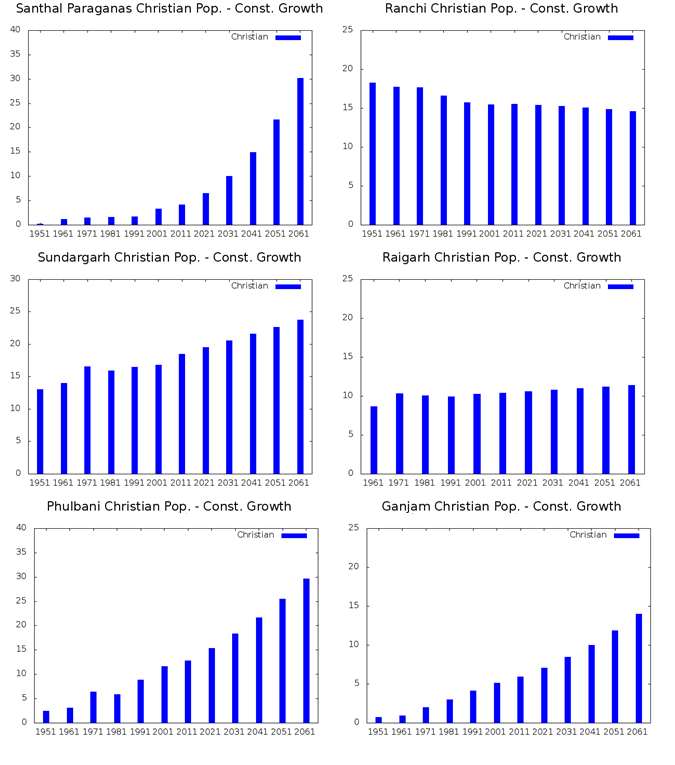 In the constant growth model, we have assumed that the average growth over the last 2 decades for the different communities will hold in future and have predicted the populations based on those numbers. The populations of the various communities in the various districts have been shown above.
One sees the Christian population of Phulbani, Santhal Paraganas, and Sundargarh cross 20% by 2061 in this model. The Christian population of Ganjam rises from 0.7% in 1951 to 13.9% by 2061. The Christian population of Ranchi has held its share, despite massive Hindu immigration from the other states to this district and is indeed, now beginning to rise again. In Raigarh, the Christian population has held its share despite heavy immigration from the other areas.
Polynomial Model:
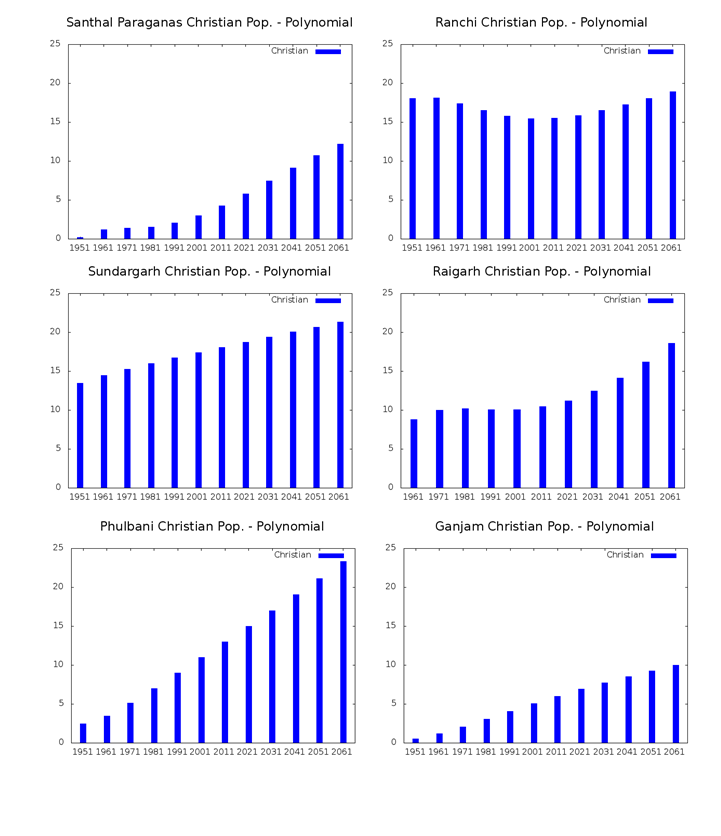 In the polynomial model, we have fitted a cubic polynomial, minimising the square error for the different communities. The cubic model can more accurately model the rapid rises and falls in the changes.
In the polynomial model, the Christian population of Raigarh, Ranchi, Phulbani, and Sundargarh is seen getting close to or beyond 20%. In Ganjam, it touches 10%, while in Santhal Paraganas, it is seen hitting 13% of the total population. We believe this technique to be the most accurate representation of the different models.
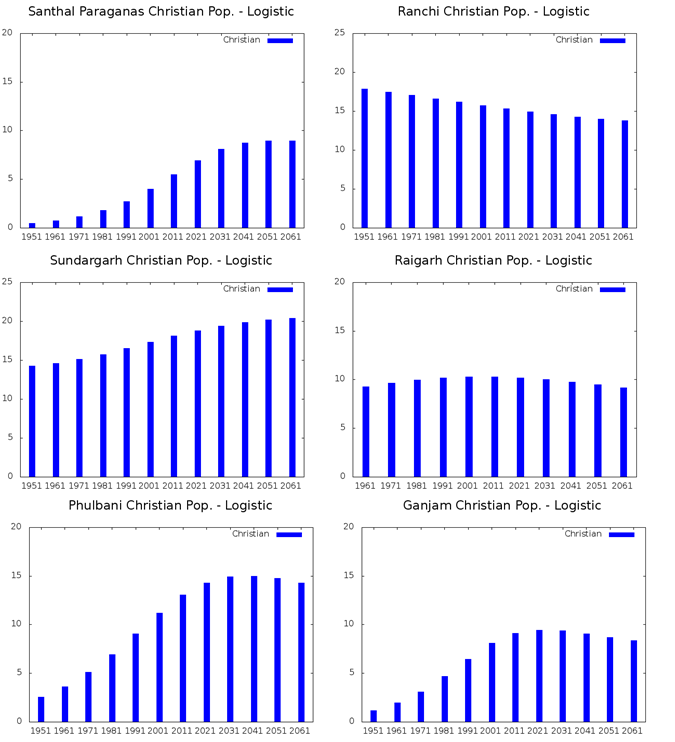
Logistic Model:
In this logistic model, we try to fit a logistic curve to the data points, minimising the square error in the process. We do not believe that this technique is a good fit for the region that is showing rapid changes in populations like Ranchi, Ganjam or Santhal Parganas. However, for the sake of completeness, we have included this technique in our examination too. The logistic model may be considered a lower bound on the changes possible. However, the most conservative case shows the Christians hitting 10% or more in almost all these districts, where just a hundred and fifty years ago, there were barely any Christians.
Conclusion:
In this article, we have examined the Christianisation of the tribal heartlands. We have shown the sharp fall of the Indic population of the tribal heartlands since independence, and in particular, in the last two decades. It is clear that though the Christianisation of the tribal region has been proceeding apace from the 1850s, it has accelerated greatly since 1991. In the second and concluding part of this article, we examine the causes, and history of this rapid Christianisation and attempt to provide some solutions to this phenomenon.
References:
All the district wise religious data are taken from the respective census and from [8]
[1] Shanmukh, Dikgaj and Saswati Sarkar, “Western Uttar Pradesh and Southern Uttarakhand: Muslim Majority by 2061?” http://www.dailyo.in/politics/population-muslims-muzaffarnagar-uttarakhand-shamli-western-uttar-pradesh-hindus-sikh-demography/story/1/10631.html
[2] Shanmukh, Dikgaj and Saswati Sarkar, “A Demographic Warning for West Bengal”, https://www.myind.net/demographic-warning-west-bengal
[3] Shanmukh, Saswati Sarkar, Dikgaj and Aparna, “Will Assam be Muslim Majority in the next 40 years?” https://indiafacts.org/will-assam-muslim-majority-next-40-years/
[4] Shanmukh, Saswati Sarkar, Dikgaj, and Aparna, “Kerala and South Tamil Nadu – A Case of Hindu Fade out” https://indiafacts.org/kerala-south-tamil-nadu-case-hindu-fade/
[5] Shanmukh, Vikram, Aparna, Saswati Sarkar, and Dikgaj, “The Demographic expansion of Kashmir and the shrinking of Jammu and Ladakh” https://www.myind.net/demographic-expansion-kashmir-and-shrinking-jammu-and-ladakh#.V3UOVSF0xwc.twitter
[6] Shanmukh, Aparna, Vikram, Arihant, Saswati Sarkar and Dikgaj, “Hotspots in the Hindi Belt – the Northern Arc’’, p1. https://www.pgurus.com/hotspots-hindi-belt-part-1-northern-arc/ p2. https://www.pgurus.com/hindu-population-shrinking-part-2-hotspots-series/ p3. https://www.pgurus.com/computed-hindu-muslim-christian-growth-part-3-hotspots-series/
[7] John Dayal, “From St. Thomas Christians to Crypto-Christians’’, http://johndayal.com/thomas-christians-crypto-christians/
[8] AP Joshi, MD Srinivas and JK Bajaj, “Religious Demographics of India’’, CPS Publications. Srinivas and JK Bajaj.
Disclaimer: The facts and opinions expressed within this article are the personal opinions of the author. IndiaFacts does not assume any responsibility or liability for the accuracy, completeness, suitability, or validity of any information in this article
Maoism and Atheism are a stop gap arrangement before converting them to Christianity by these crooks.
Hallelujah,Thank you,Jesus.
The best way to counter these European imperialist enslaving people,by converting then to a European induced ideology and their white skinned aryan god, is to show there history. Plain and simple.
Bible-
The master of that servant will come on a day when he does not expect him, and at an hour of which he is unaware. Then He will cut him to pieces and assign him a place with the unbelievers. 47That servant who knows his master’s will but does not get ready or follow his instructions will be beaten with many blows. 48But the one who unknowingly does things worthy of punishment will be beaten with few blows. From everyone who has been given much, much will be required; and from him who has been entrusted with much, even more will be demanded.…24Then the end will come, when He hands over the kingdom to God the Father after He has destroyed all dominion, authority, and power. 25For He must reign until He has put all His enemies under His feet. 26The last enemy to be destroyed.
“Anyone who attempts to construe a personal view of God which conflicts with Church dogma must be burned without pity.”
– Pope Innocent III
The Heretics Fork
This instrument consisted of two little forks one set against the other, with the four prongs plunged into the flesh, under the chin and above the chest, with hands secured firmly behind their backs. A small collar supported the instrument in such a manner that the victims were usually forced to hold their head erect, thus preventing any movement.
The forks did not penetrate any vital points, and thus suffering was prolonged and death was always nearly avoided. The pointed prongs on each end to crane the persons head made speech or movement near impossible. The Heretics Fork was very common during the height of the Spanish Inquisition.
The Pear
The pear was a torture device used on females. This device was inserted into the vagina, or mouth of the victim and then expanded by force of the screw to the maximum aperture setting of the victims cavity. The antrum would then irremediably become lacerated, nearly always fatally, ripping the tissue, flesh and membranes.
This item became extensively applied throughout the Spanish Inquisition to force confessions from those accused of Witchcraft. The pointed prongs at the end of the segments serve better to rip into the throat, the intestines or the cervix. Many paid dearly when the Pear was their fate.
The Branks
The Branks, also sometimes called Dame’s Bridle, or Scold’s Bridle comprised of a metal facial mask and spiked mouth depressor that was implemented on housewives up until the early 19th century. Many clergymen sustained in this husband’s right to handle his wife, and to use “salutary restraints in every case of misbehavior” without the intervention of what some court records of 1824 referred to as “vexatious prosecutions.”
Generally a husband would need only to accuse his wife of disagreeing with his decisions, at which the Branks could be applied. The subject would then be paraded through the streets, or chained to the market cross where she was exposed to public ridicule.
The Wheel
The wheel was one of the most popular and insidious methods of torture and execution practiced. The giant spiked wheel was able to break bodies as it rolled forward, causing the most agonizing and drawn-out death. Other forms include the “braided” wheel, where the victim would be tied to the execution dock or platform. Their limbs were spread and tied to stakes or iron rings on the ground. Slices of wood were placed under the main joints, wrists, ankles, knees, hips, and elbows. The executioner would then smash every joint with the iron-tyred edge of the wheel–however the executioner would avoid fatal blows to give the victim a painful death.
According to a German chronicler, the victim was transformed into a huge screaming puppet writhing in their own blood. It looked like a sea monster with four tentacles, and raw slimy shapeless flesh, mixed with splinters of bone. After the smashing had taken place the victim would literally be “braided” into the wheel and hung horizontally at the top of the pole.
The Breast Ripper
The name of this device speaks for itself. Women condemned of heresy, blasphemy, adultery, and witchcraft often felt the wrath of this device as it violently tore a breast from their torso.
This device was highly put into service during the massacre of the Danes.
Hanging cages
These cages were usually hung around the outsides of town halls and ducal palaces, they were also near the town’s hall of justice and surprisingly cathedrals. The victim, naked and exposed, would slowly wither from hunger and thirst. The weather would second the victims death by heat stroke and sunburn in the summer and cold in the winter.
The victims and corpses were usually previously mutilated before being put in the cages to make a more edifying example of the punishment. The cadavers were left in the cages until the bones literally fell apart.
The Garotte
Originally, the garotte was simply hanging by another name. However, during Medieval times, executioners began to refine the use of rope until it became as feared and as vile as any serious punishments. Executioners first used the garotte to end the suffering of heretics broken on the wheel, but by the turn of the 18th century the seed of an idea involving slow strangulation was planted in the minds of lawmakers.
At first, garottes were nothing more than an upright post with a hole bored through. The victim would stand or sit on a seat in front of the post and chanting crowd, and a rope was looped around his or her neck. The ends of the cords were fed through the hole in the post. The executioner would then pull on both ends of the cord, or twist them tourniquet-styled, slowly strangling the victim. Later modifications included a spike fixed into the wood frame at the back of the victim’s neck, parting the vertebrae as the rope tighten.
The Head Crusher
With the victim’s chin placed on the lower bar, a screw then forces the cap down on the victims cranium. The recipients teeth are crushed and forced into the sockets to smash the surrounding bone. The eyes are compressed from their sockets and brain from the fractured skull.
This device, although not a form of capital punishment, is still used for interrogational purposes. It was to inflict extreme agony and shock and leave the victim in its grasp for hours. Other methods included the head screw (below) which was placed around the forehead and tighten. The accused became so frantic by the extreme panic of having their head crushed that they confessed to anything.
Burnt at the Stake
If the Inquisitor wanted to be sure no relics were left behind by an accused and convicted heretic, he would select death by burning at the stake as the preferred method of execution. With few exceptions, death came from being burned alive. Frequently, burning a victim at the stake was cause for a crowd. Not content to merely learn about the spectacle after it was over, the masses wanted to be entertained.
Derby’s dose was a form of torture used in Jamaica to punish slaves who attempted to escape or committed other offenses like stealing food. According to Malcolm Gladwell in his 2008 book Outliers, “The runaway would be beaten, and salt pickle, lime juice, and bird pepper would be rubbed into his or her open wounds. Another slave would defecate into the mouth of the miscreant, who would then be gagged for four to five hours.”[1] The punishment was invented by Christian Thomas Thistlewood, a slave overseer and named for the slave, Derby, who was made to undergo this punishment when he was caught eating young sugar cane stalks in the field on May 25, 1756.
1690 ,First offenders were severely whipped, followed by slitting the nose and burning “some part of his face with a hot iron” and even death for those who attacked whites a second or third time. who ran away more than once could be branded with an R on their cheek and might suffer the loss of an ear. Castrating male slaves branding an R on the left cheek of female slaves punished a fourth offense. A fifth could be punished either cutting the tendon in one leg or death.
Alabama, 1833, section 31 – “Any person or persons who attempt to teach any free person of color, or slave, to spell, read, or write, shall, upon conviction thereof by indictment, be fined in a sum not less than two hundred and fifty dollars, nor more than five hundred dollars.”
Alabama, 1833, section 32 – “Any free person of color who shall write for any slave a pass or free paper, on conviction thereof, shall receive for every such offense, thirty-nine lashes on the bare back, and leave the state of Alabama within thirty days thereafter…”
Alabama, 1833, section 33 – “Any slave who shall write for any other slave, any pass or free-paper, upon conviction, shall receive, on his or her back, one hundred lashes for the first offence.
We need to teach false history because the are Hindu
-Thomas Macauley Christian Right winger of Indian education.
I did not come to bring peace but war and violence, slaves obey your masters.
-Christ, the white idol of Rome.
When European Christian say Christ is love it’s in the same vein as when Isis say Allah is peace and love. It means the twisted warped love where your are loved for converting and eradicating non believers, and making them into a European or Arab duplicate with their names, heritage, festivals, history and culture….forcing to eradicate yours to honor an imperialistic communal religious belief and bow to their god, while your kill your own.
https://uploads.disquscdn.com/images/5c4e82bf5f2c12ccf5675a72fae044dfa5bd22a939c312a0d0d12fcd560c8f25.jpg
https://uploads.disquscdn.com/images/452d434e68359512742f347cd349c41dc044bf96f22c1e54f02749aaea3d31ec.jpg